Small Objects, Big Gains: Benchmarking Tigris Against AWS S3 and Cloudflare R2

One of Tigris's standout capabilities is its performance when storing and retrieving small objects. To quantify this advantage, we benchmarked Tigris against two popular object stores—AWS S3 and Cloudflare R2—and found that Tigris consistently delivers higher throughput and lower latency. These gains let you use a single store for everything from tiny payloads to multi-gigabyte blobs without sacrificing efficiency.
Under the hood, Tigris accelerates small-object workloads by (i) inlining very small objects inside metadata records, (ii) coalescing adjacent keys to reduce storage overhead, and (iii) caching hot items in an on-disk, LSM-backed cache.
Summary
Our benchmarks reveal that Tigris significantly outperforms both AWS S3 and Cloudflare R2 for small object workloads. Our benchmarks show Tigris achieves sub-10ms read latency and sub-20ms write latency, while sustaining 4 x throughput than S3 and 20 x throughput than R2 for both operations.
To ensure our findings are reproducible, we outline the full benchmarking methodology and provide links to all artifacts.
Object Storage That's Faster Than S3 and R2
Tigris is 5.3x faster than S3 and 86.6x faster than R2 for small object reads. If your workload depends on reading lots of small objects—logs, AI features, or billions of tiny files—this matters.
Benchmark Setup
We used the Yahoo Cloud Serving Benchmark (YCSB) to evaluate the three systems. We added support for S3-compatible object storage systems (such as Tigris and Cloudflare R2), which was merged shortly after publish.
All experiments ran on a neutral cloud provider to avoid vendor-specific optimizations. Table 1 summarizes the test instance:
Table 1: Benchmark host configuration.
| Component | Quantity |
|---|---|
| Instance type | VM.Standard.A1.Flex (Oracle Cloud) |
| Region | us-sanjose-1 (West Coast) |
| vCPU cores | 32 |
| Memory | 32 GiB |
| Network bandwidth | 32 Gbps |
YCSB Configuration
We benchmarked a dataset of 10 million objects, each 1 KB in size. You can view our configuration in the tigrisdata-community/ycsb-benchmarks GitHub repo, specifically at results/10m-1kb/workloads3.
Our buckets were placed in the following regions per provider:
| Provider | Region |
|---|---|
| Tigris | auto (globally replicated, but operating against the sjc region) |
| AWS S3 | us-west-1 (Northern California) |
| Cloudflare R2 | WNAM (Western North America) |
Results
Using YCSB we evaluated two distinct phases: (i) a bulk load of 10 million 1 KB objects and (ii) a mixed workload of one million operations composed of 80% reads and 20% writes.
Loading 10 million objects
Figure 1 (below) plots the end-to-end ingestion time. Tigris finishes the load in 6711 s, which is roughly 31 % faster than S3 (8826 s) and an order of magnitude faster than R2 (72063 s).
Latency drives this gap. As shown in Figure 2, R2's p90 PUT latency tops 340 ms whereas Tigris stays below 36 ms and S3 below 38 ms. Table 2 summarises the key statistics.
Table 2: Load-phase latency and throughput metrics.
| Service | P50 Latency (ms) | P90 Latency (ms) | Runtime (sec) | Throughput (ops/sec) |
|---|---|---|---|---|
Tigris | 16.799 ms | 35.871 ms | 6710.7 sec | 1490.2 ops/sec |
S3 | 25.743 ms (1.53x Tigris) | 37.791 ms (1.05x Tigris) | 8826.4 sec (1.32x Tigris) | 1133 ops/sec (0.76x Tigris) |
R2 | 197.119 ms (11.73x Tigris) | 340.223 ms (9.48x Tigris) | 72063 sec (10.74x Tigris) | 138.8 ops/sec (0.09x Tigris) |
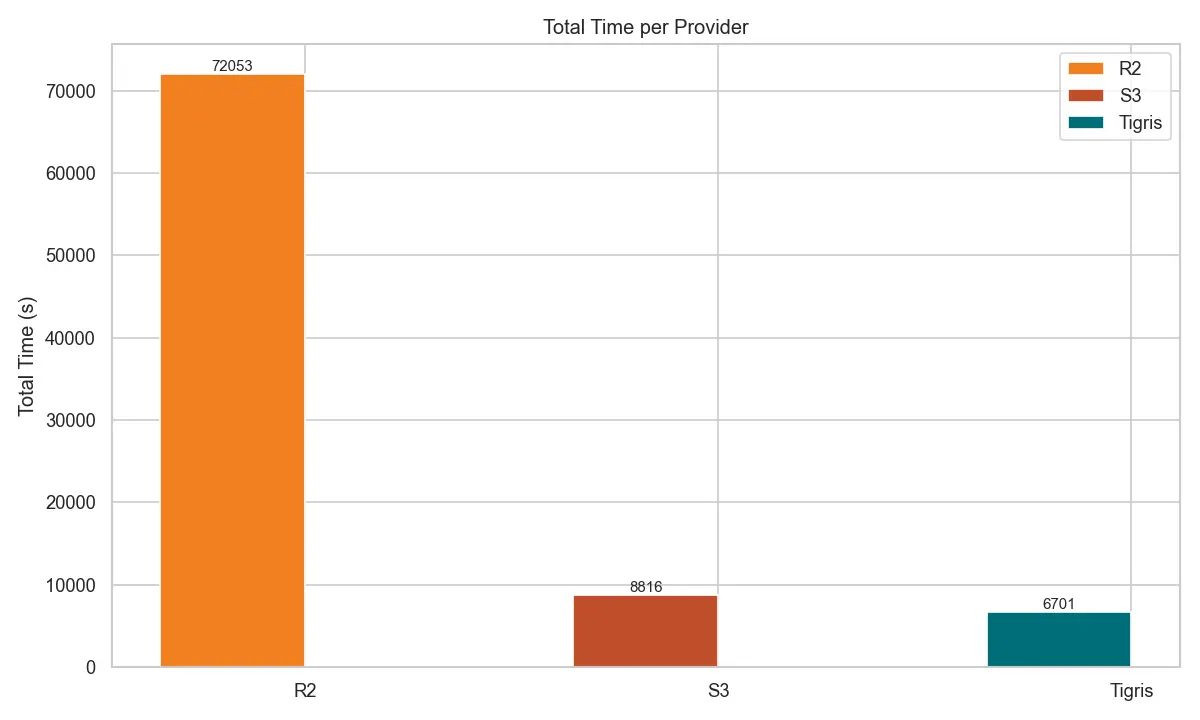
Figure 1: Total load time for loading 10 M 1 KB objects.
R2 takes more than 300ms to write a single object which explains the slowness of the data load.
While comparing Tigris latency to S3, it is still better but not the same margin as compared to R2.
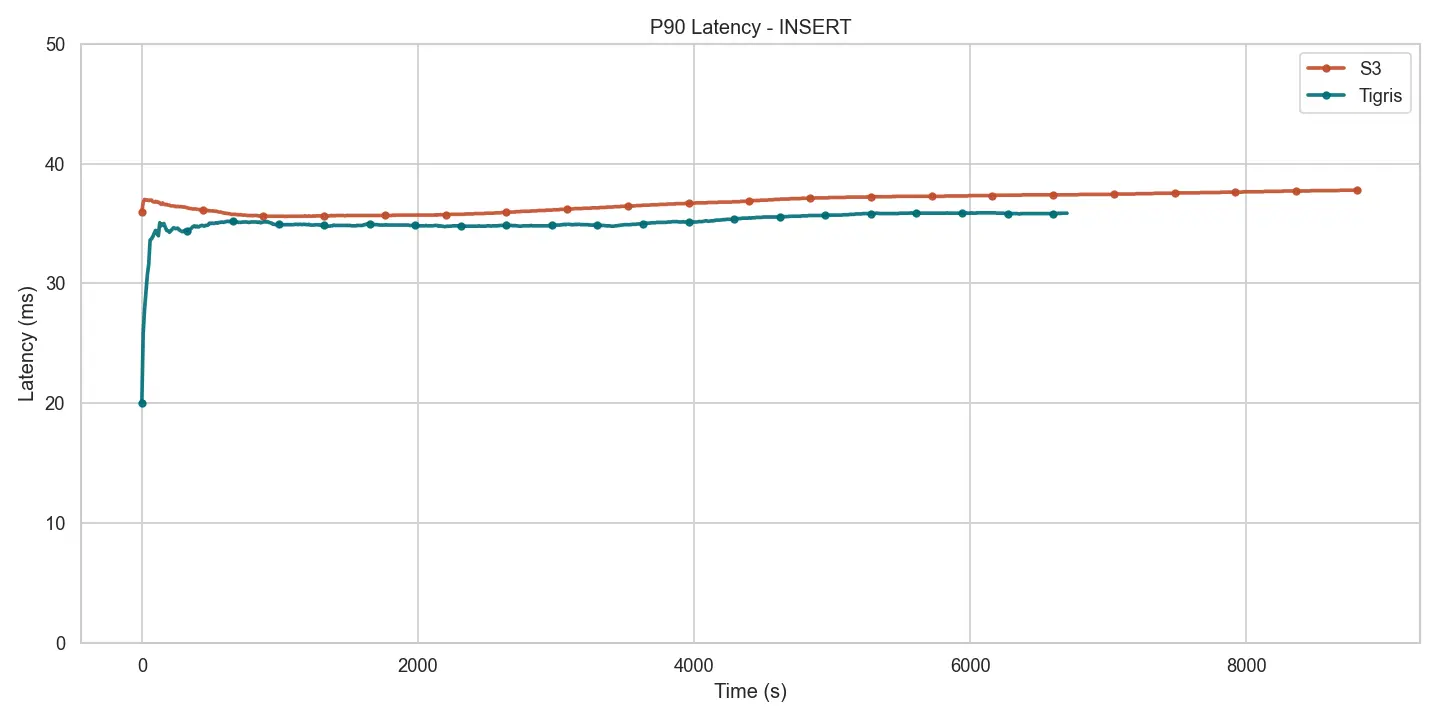
Figure 2: PUT p90 latency during load phase.
1 million operations (20% write, 80% read)
This is the run phase of the YCSB benchmark. As a reminder, it is a 20% write and 80% read workload totaling 1 million operations.
Read throughput
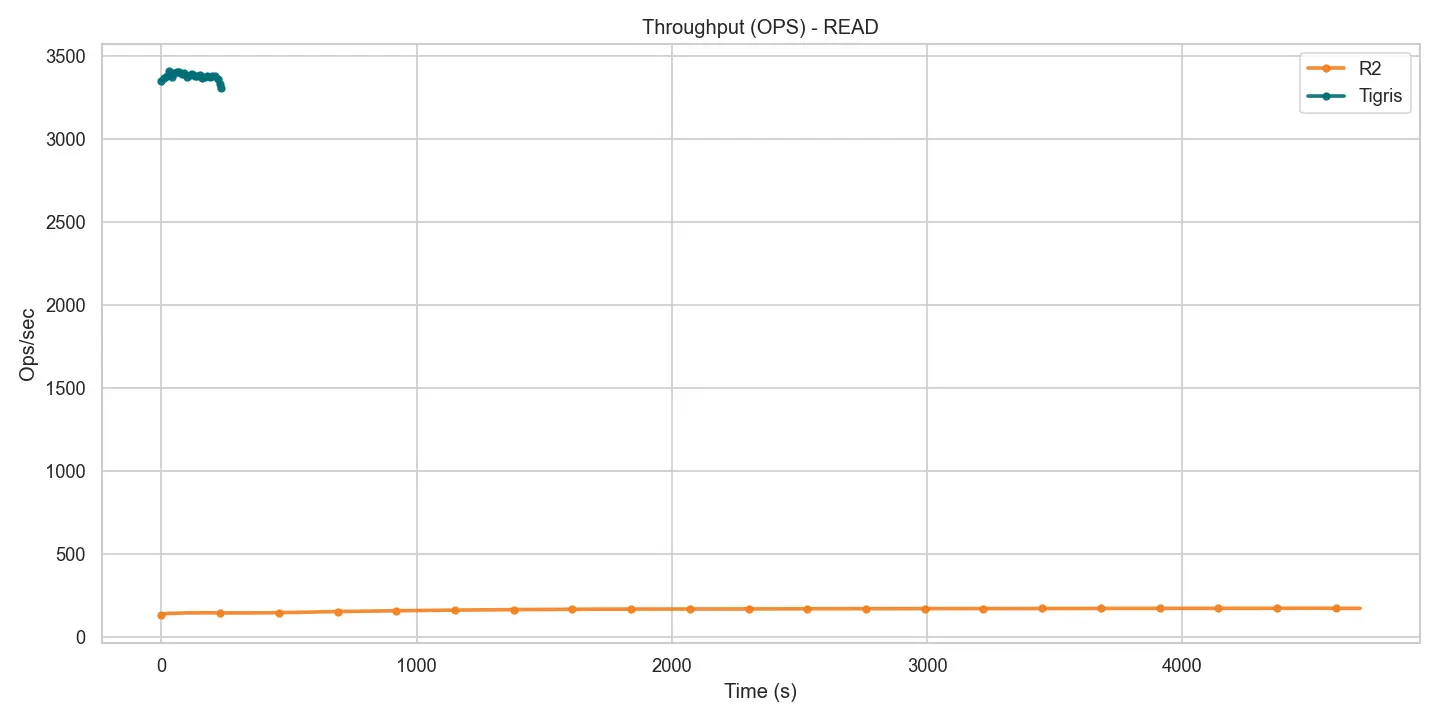
Figure 3: Read throughput during mixed workload (Tigris vs R2).
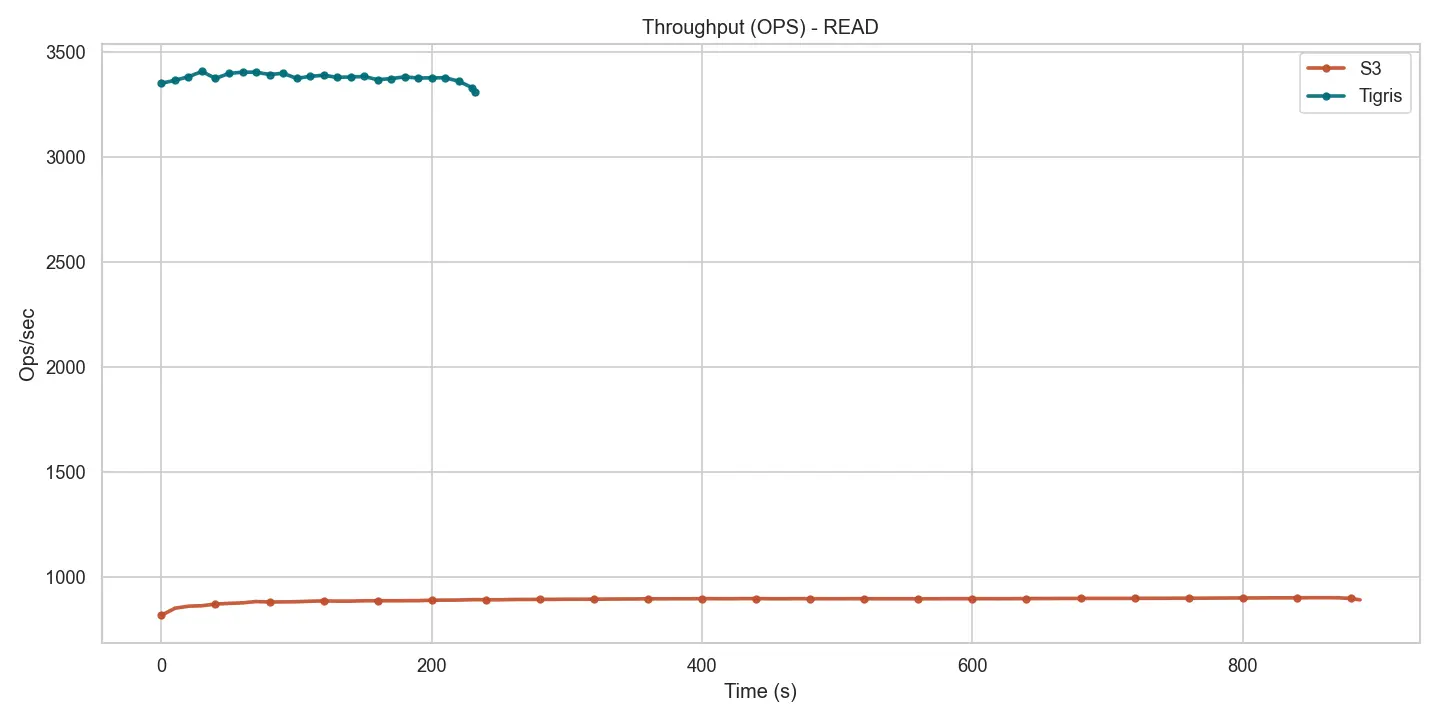
Figure 4: Read throughput during mixed workload (Tigris vs S3).
Throughput traces for all three providers remain stable—useful for capacity planning—but the absolute rates diverge sharply. Tigris sustains ≈3.3 k ops/s, nearly 4 × S3 (≈ 892 ops/s) and 20 × R2 (≈ 170 ops/s). This headroom lets applications serve real-time workloads directly from Tigris.
Read latency
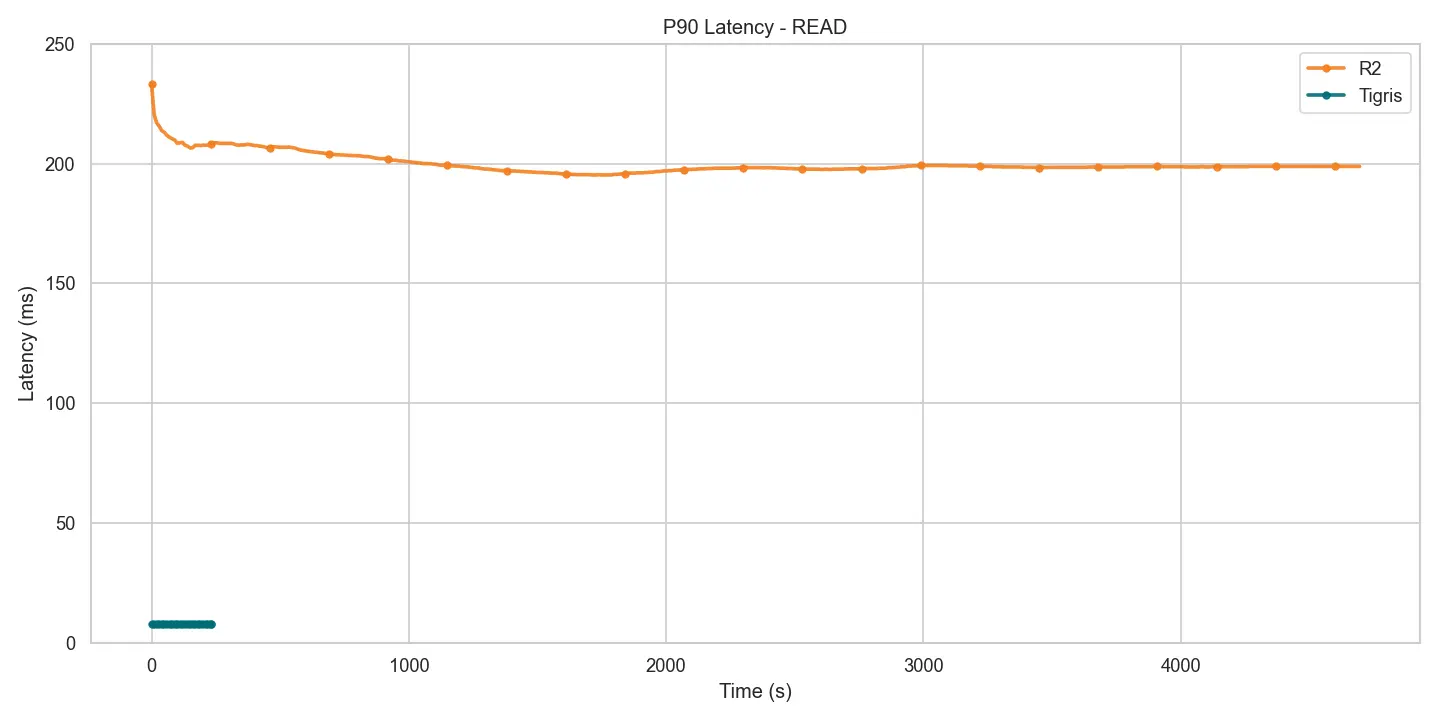
Figure 5: Read p90 latency during mixed workload (Tigris vs R2).
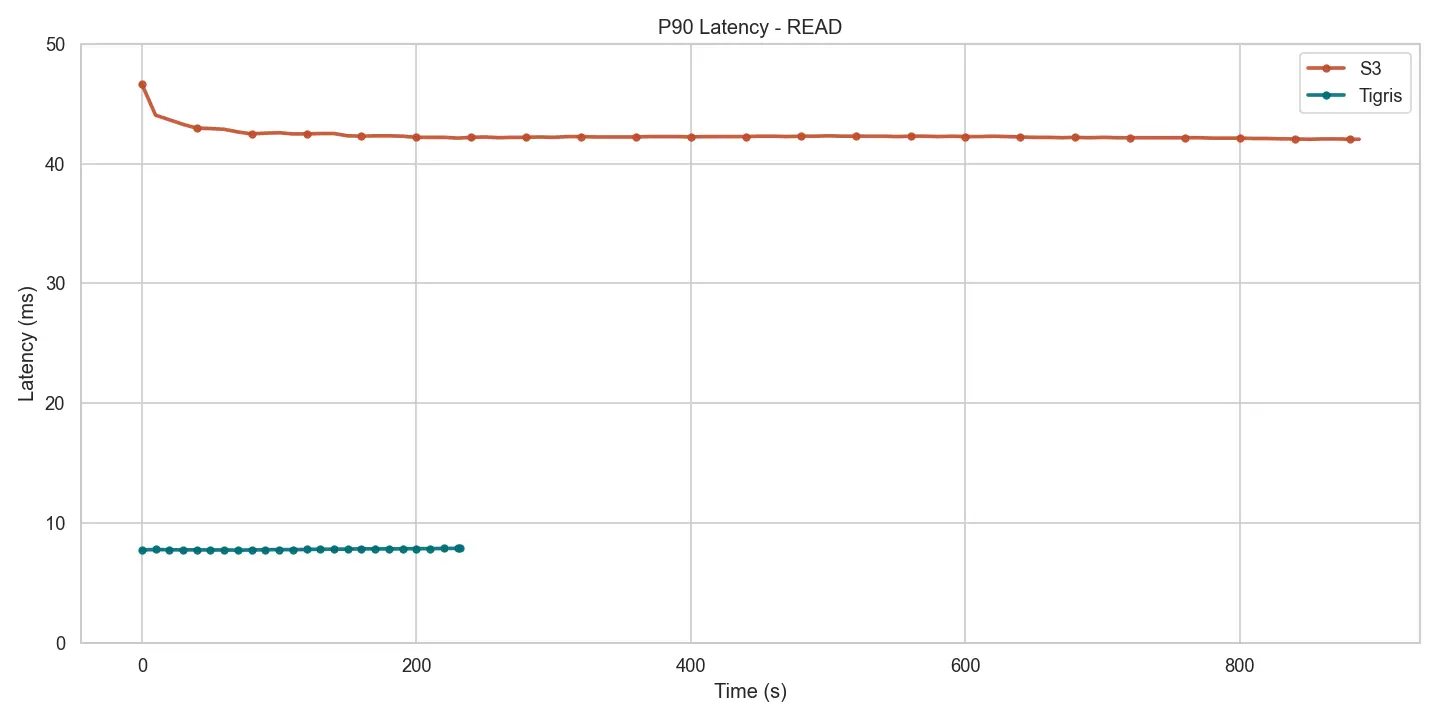
Figure 6: Read p90 latency during mixed workload (Tigris vs S3).
Latency follows the same pattern. Tigris keeps p90 below 8 ms; S3 settles around 42 ms, and R2 stretches beyond 199 ms. At sub-10 ms, reads feel closer to a key-value store than a traditional object store.
Write throughput
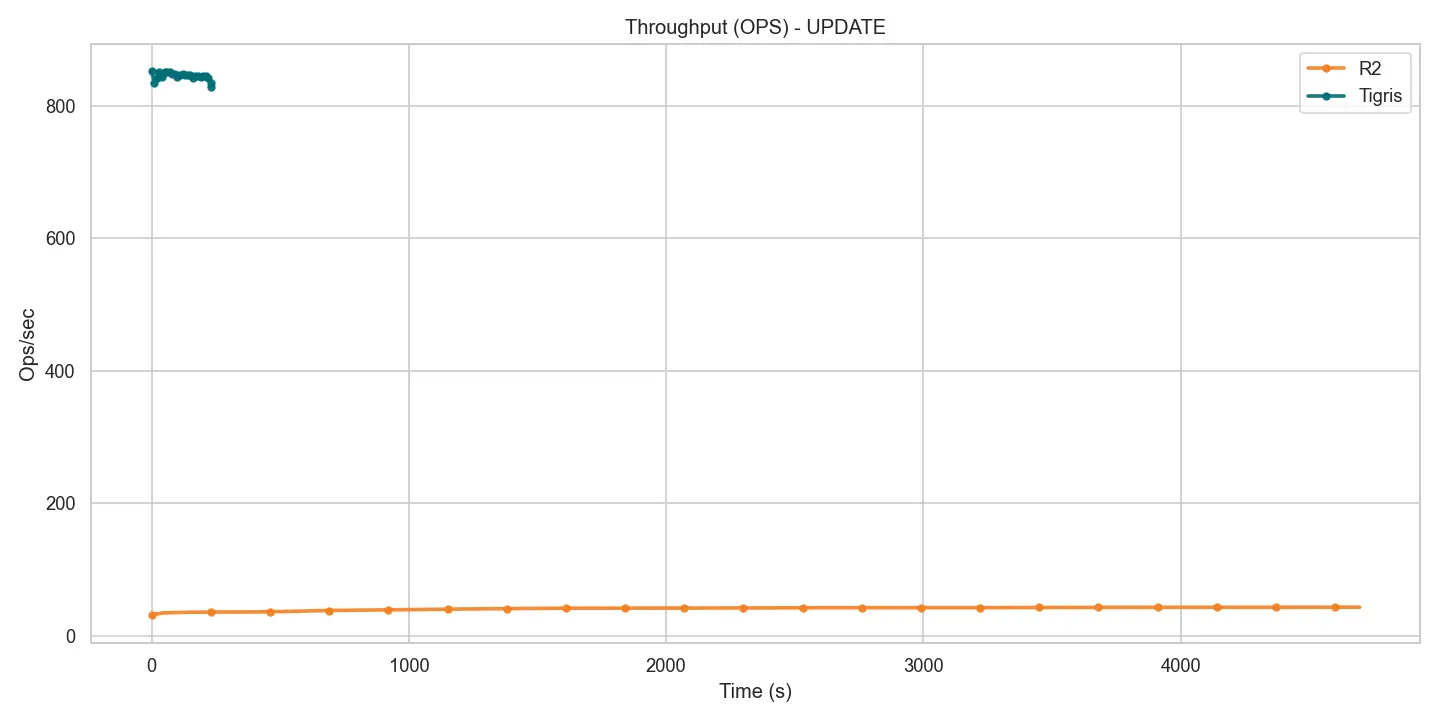
Figure 7: Write throughput during mixed workload (Tigris vs R2).
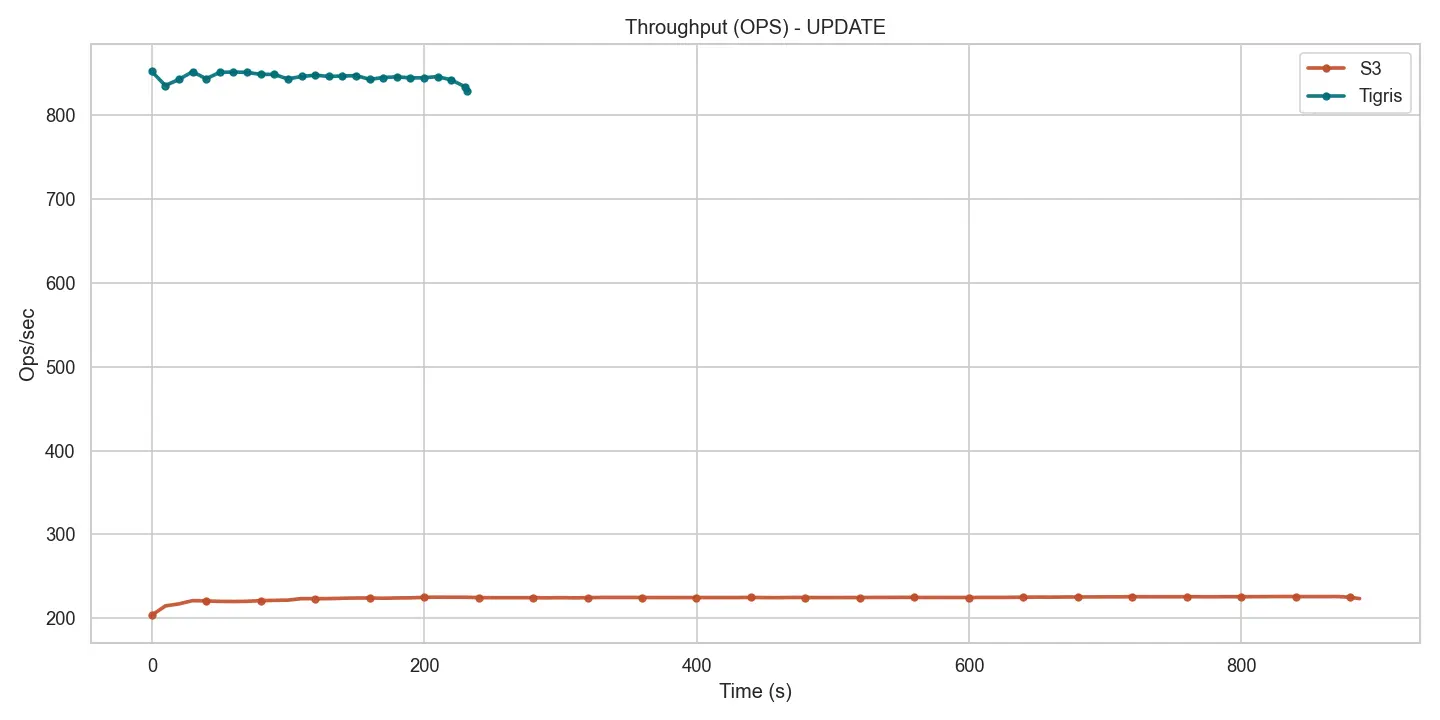
Figure 8: Write throughput during mixed workload (Tigris vs S3).
Write throughput shows the same spread. Tigris delivers ≈ 828 ops/s, close to 4 × S3 (224 ops/s) and 20 × R2 (43 ops/s), giving plenty of margin for bursty ingest pipelines.
Write latency
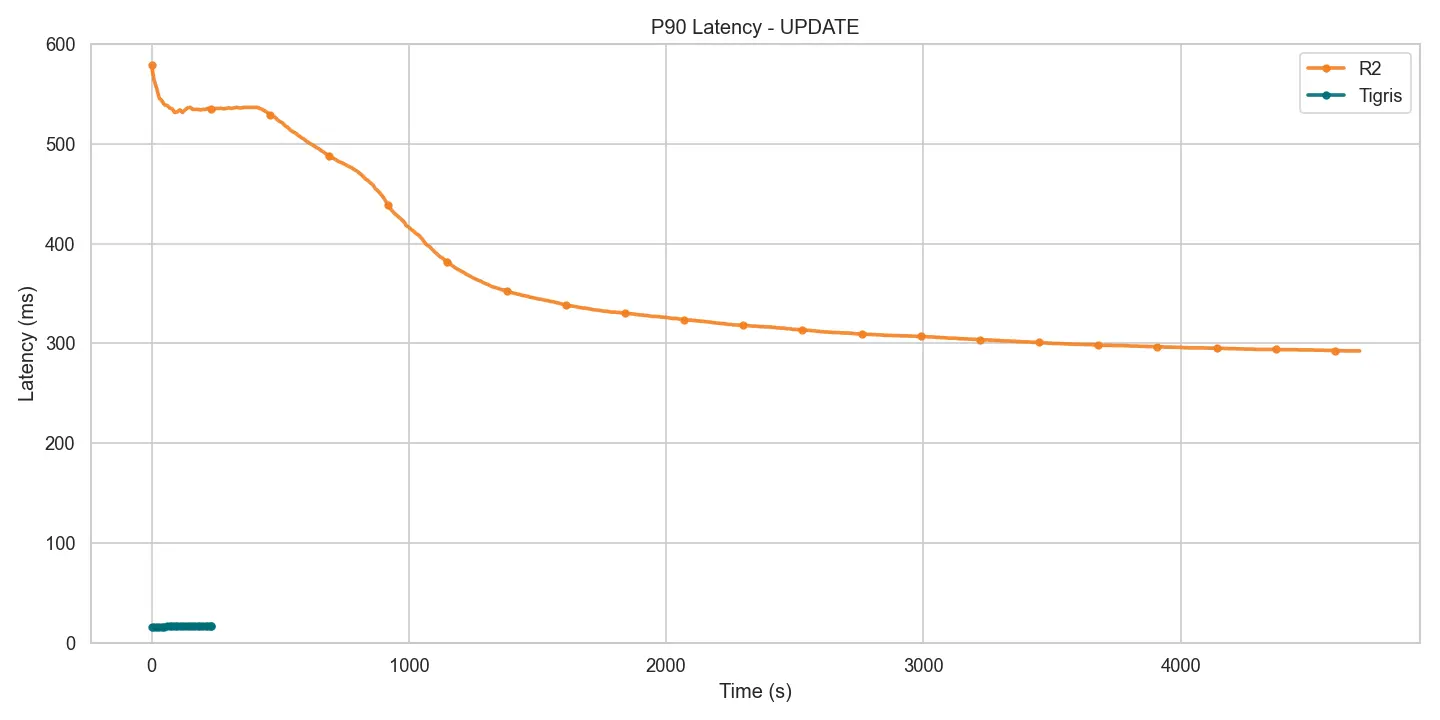
Figure 9: Write p90 latency during mixed workload (Tigris vs R2).
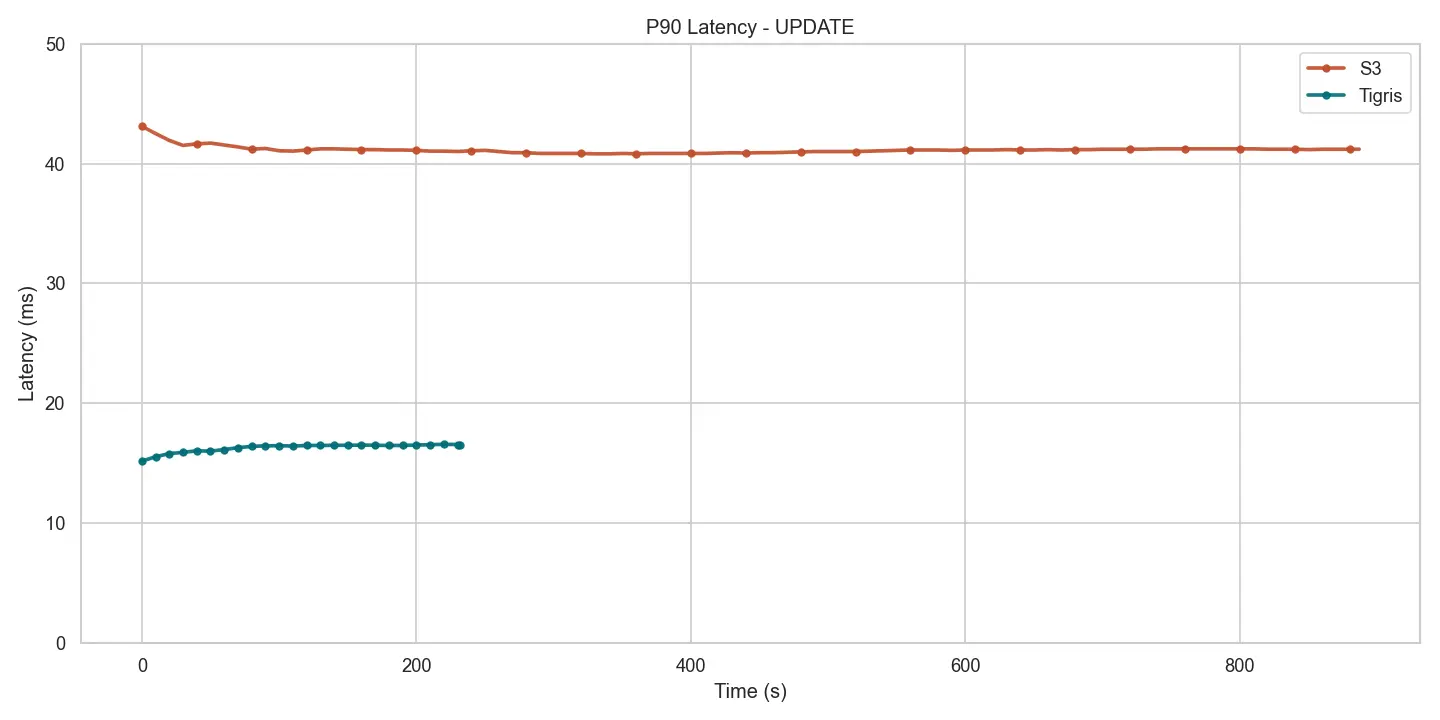
Figure 10: Write p90 latency during mixed workload (Tigris vs S3).
Write-side tail latency tracks proportionally: < 17 ms for Tigris, ≈ 41 ms for S3, and > 680 ms for R2—an order-of-magnitude gap that can make or break user-facing workloads.
To summarize:
Table 3: Read and throughput metrics.
| Service | P50 Latency (ms) | P90 Latency (ms) | Runtime (sec) | Throughput (ops/sec) |
|---|---|---|---|---|
Tigris | 5.399 ms | 7.867 ms | 241.7 sec | 3309.8 ops/sec |
S3 | 22.415 ms (4.15x Tigris) | 42.047 ms (5.34x Tigris) | 896.8 sec (3.71x Tigris) | 891.5 ops/sec (0.27x Tigris) |
R2 | 605.695 ms (112.19x Tigris) | 680.959 ms (86.56x Tigris) | 4705.3 sec (19.47x Tigris) | 42.6 ops/sec (0.01x Tigris) |
Table 4: Update and throughput metrics.
| Service | P50 Latency (ms) | P90 Latency (ms) | Runtime (sec) | Throughput (ops/sec) |
|---|---|---|---|---|
Tigris | 12.855 ms | 16.543 ms | 241.6 sec | 828.1 ops/sec |
S3 | 26.975 ms (2.1x Tigris) | 41.215 ms (2.49x Tigris) | 896.8 sec (3.7x Tigris) | 223.6 ops/sec (0.27x Tigris) |
R2 | 605.695 ms (47.12x Tigris) | 680.959 ms (41.16x Tigris) | 4705.3 sec (19.4x Tigris) | 42.6 ops/sec (0.05x Tigris) |
Conclusion
Tigris outperforms S3 and comprehensively outperforms R2 for small object workloads. The performance advantage stems from Tigris's optimized architecture for small objects. While S3 and R2 struggle with high latency on small payloads (R2's p90 PUT latency reaches 340ms), Tigris maintains consistent low latency through intelligent object inlining, key coalescing, and LSM-backed caching.
These results demonstrate that Tigris can serve as a unified storage solution for mixed workloads, eliminating the need to maintain separate systems for small and large objects. Whether you're storing billions of tiny metadata files or streaming gigabytes of video data, Tigris delivers optimal performance across the entire object size spectrum.
You can find the full benchmark results in the ycsb-benchmarks repository.
