We do our billing with Prometheus


A blue tiger bearing a torch running through Gerudo Town while a blood moon ominously rises in the distance.
Billing is one of those problems that seems simple until you actually try doing it. Sure there’s ways to make it tolerable, but the main problem with billing is that it’s a social problem that we’re solving with technology. Billing is also very high friction when errors come up and it’s the main barrier between your users and your product.
It’s even worse when you work on a product like Tigris where the billing is usage-based. You can’t just charge users a fixed monthly rate, some users use only a few megabytes of storage and other users use petabytes. Most of the time adding a billable item to customer invoices is a lot of overhead. You have to poke at things, make sure the usage based billing is within the realm of reality, and actually implement the backend logic for making sure the billing makes sense.
At Tigris, we have monitoring set up so that we can monitor the performance of every aspect of the system to make sure that it’s performing to our expectations. In order to make things easy to monitor, adding a new counter for every time each customer hits a specific API call could be as easy as one statement in Go:
promauto.NewGaugeVec(
  // Information about the gauge
  prometheus.GaugeOpts{
    Namespace: "tigrisos",
    Subsystem: "defrobnicator",
    Name: "defrobnication_bytes",
    Help: "The number of bytes that each organization has defrobnicated",
  },
  // Labels / arguments to the gauge measurements
  []string("org_id"),
)
This would create a metric for an imaginary “defrobnicator” subsystem that counts the number of bytes that get defrobnicated per organization. We’d also add a number of other metrics that measure things like the amount of time spent defrobnicating or break it down further, but at a high level adding a metric is a single statement in code. When we create these metrics, they’re instantly available to our internal dashboards. They’re collected and stored in our VictoriaMetrics clusters, and we rely on them constantly.
Either way, metrics are very low friction and collect the same kind of information that would be used for billing. What if we just used all of this robust, easy to collect, and reliable data to do billing?
We use our metrics data to do billing
Yep, we use that metrics data to do our billing. In fact, we actually use the same metrics data that you have access to in your admin console:
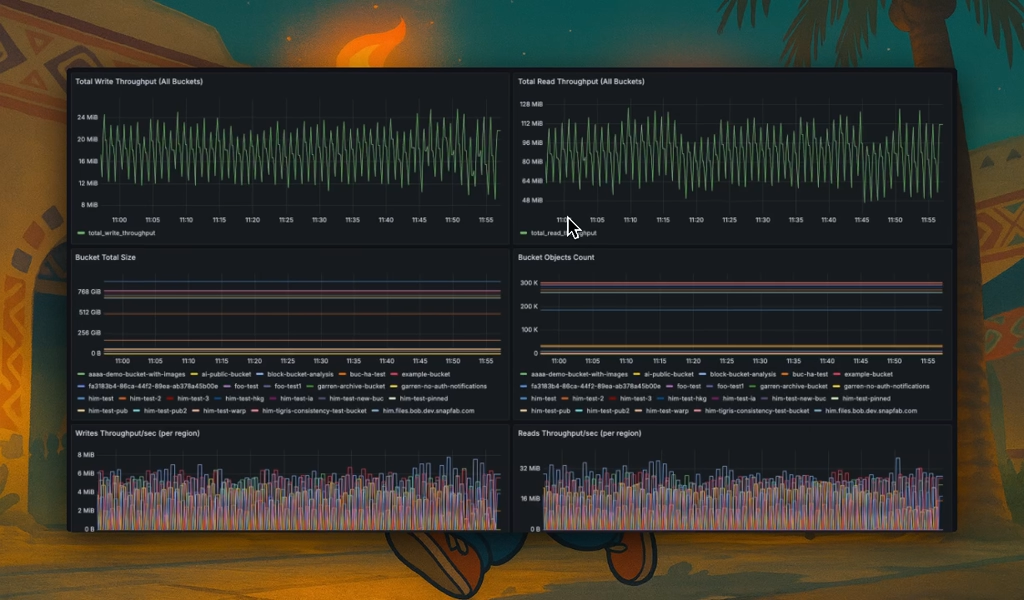
When you look at the metrics in your admin console, you see the exact same metrics that we bill you on. These are also the same metrics that we use for alerting. We feel that it’s only fair for you to have access to the same metrics that you’re billed on, and we put that belief into practice by giving you the access you need.
At the same time, doing this means that the imaginary defrobnication subsystem can now become a billable item with much less code. We don’t need to store events every time someone defrobnicates something. We don’t need to write the code to parse those events and accumulate the number of bytes every time someone defrobnicates something. We just create a new billable item, attach it to a per-organization metrics query, and file the pull request.
Why didn’t you use events to do this?
One of the most common ways to do usage based billing is to accumulate events to a database / object storage bucket and then iterate over them to get reports. Those reports will then be submitted to Stripe, and that updates the amount of money that users get charged. This works for a large number of organizations, but at some level you still need to query “the database” for information like how many bytes are stored in each bucket or how many users are in an organization.
However, for everything else, why not use data we’re already collecting? Why should we need to emit and parse events to measure how many times HeadObject is called for a given organization and a given storage tier?
The problems with doing this
This approach is good enough for us, but it’s not architecturally perfect. We tried to design this in such a way that the inherent flaws in this approach benefit you.
Metrics collection is asynchronous
One of the biggest problems with using Promethus metrics is that collection is asynchronous. Clients don’t push out metrics to the central store, the metrics store actively collects metrics from the subsystems it’s monitoring. This means that you need to decide how often the metrics should be scraped. Scraping more often means that you increase system load, but get higher detail in your metrics collection. Scraping less often means that you decrease system load, but you can lose up to the last window of data when the service restarts for an update.
We do our scraping every 10 seconds. When we restart the services for code changes, we lose up to 10 seconds of data from our internal monitoring. This is something we’ve just come to accept as the “cost of doing business”, but this actually means that some metrics-based billing actions (like the number of GetObject/HeadObject calls per bucket) get dropped too. This error leans in your favor because if we can’t observe it in our metrics store, we can’t bill for it.
Our metrics are high cardinality
Remember how I mentioned that you can add labels/arguments to metrics? Consider these metrics on the Go garbage collector:
# HELP go_gc_duration_seconds A summary of the wall-time pause (stop-the-world) duration in garbage collection cycles.
# TYPE go_gc_duration_seconds summary
go_gc_duration_seconds{quantile="0"} 7.5026e-05
go_gc_duration_seconds{quantile="0.25"} 0.00014935
go_gc_duration_seconds{quantile="0.5"} 0.000183111
go_gc_duration_seconds{quantile="0.75"} 0.000245154
go_gc_duration_seconds{quantile="1"} 0.005438047
go_gc_duration_seconds_sum 73.160960312
go_gc_duration_seconds_count 139114
On the backend, VictoriaMetrics creates a separate metrics counter per metric and label value pair. This is fine for small scales such as tracking how long it takes to do a garbage collection run, but it can easily get very out of hand when you add many more variables such as tracking gRPC calls:
# HELP grpc_client_handled_total Total number of RPCs completed by the client, regardless of success or failure.
# TYPE grpc_client_handled_total counter
grpc_client_handled_total{grpc_code="Canceled",grpc_method="DefrobnicateObject",grpc_service="tigris.v1.Defrobnicator",grpc_type="unary"} 96
grpc_client_handled_total{grpc_code="DeadlineExceeded",grpc_method="DefrobnicateObject",grpc_service="tigris.v1.Defrobnicator",grpc_type="unary"} 64
grpc_client_handled_total{grpc_code="Internal",grpc_method="DefrobnicateObject",grpc_service="tigris.v1.Defrobnicator",grpc_type="unary"} 5
grpc_client_handled_total{grpc_code="OK",grpc_method="DefrobnicateObject",grpc_service="tigris.v1.Defrobnicator",grpc_type="unary"} 31462
grpc_client_handled_total{grpc_code="Unavailable",grpc_method="DefrobnicateObject",grpc_service="tigris.v1.Defrobnicator",grpc_type="unary"} 910
This creates a separate counter per gRPC response code (akin to a status code), gRPC method, gRPC service, and the RPC type (request/response and streaming). This is still generally fine as you are in control of which gRPC methods you are exposing and calling, but the biggest problem is cardinality explosion, or when user controlled data is set as inputs to metrics and then that creates new counters ad infinitum.
We track a lot of our metrics on a per-bucket basis. Any user can create any bucket named whatever they want without warning. We have at least one set of metrics for every class of call in every bucket. Billing based on these metrics means that we need to be able to limit cardinality explosions wherever possible.
One of the biggest ways this bites us is the fact that once you put a value with a label into the process-local metrics registry, that value is always present in the metrics view even if it never changes again. Imagine a scenario where a user creates 50 buckets, does a bunch of traffic in them, and then never touches them again. This would mean that our metrics scraping service would have to read that same unchanged value over and over. The only way to clear that counter would be to restart the process. This adds up at our scale.
We solved this by having our process-local metrics registry remove stale data
after it’s not changed for the last hour. We’ve found this is the best
compromise between data granularity and reducing server load. Loading the
/metrics route is nearly free at small scales, but our high cardinality
metrics data is nontrivial to render.
Another problem with high cardinality metrics is that backup tools start to have problems. Most backup tools are optimized for a cardinality in the tens. We have cardinality in the tens of thousands. We tried several backup tools and none of them worked. We ended up having to write our own backup tool.
Size reporting broke twice
When you are collecting metrics data, sometimes you run into “champagne problems”, or the unique kinds of problems that only really show up when you are quite successful. One of the ones we’ve run into is that we grew faster than our capacity planning accounted for and the size reporting broke in the admin console. This is a very good problem to have, but can manifest with issues like that.
When you put or delete objects in buckets, that causes asynchronous jobs to update the bucket size you see in the dashboard. We also have a regular job that updates the bucket size based on the contents of each bucket. When we first implemented this, we did it all with a single worker and it worked well enough.
Until it didn’t. The worker was scheduled to run once per 5 minutes and it started to take more than 5 minutes to gather this data. This caused a classic job overrun problem and resulted in the job not running as frequently as we liked, if it was collected at all.
To fix this, we ended up breaking this into multiple workers accumulating data in each bucket until it’s done. This does run the risk of under-reporting bucket size in some edge cases that we probably won’t hit in the real world, but again this is an error in your favor. This job runs pretty regularly though, so it’s probably not as much of an issue in practice.
The upsides
Once we’ve implemented and validated all this, adding billable features based on usage is as easy as creating a product in stripe, tying it to a per-org metrics query, and filing a pull request. That’s it! We’re big on site reliability here (sometimes we joke that we’re an SRE consultancy with an exclusive internal object storage client), and reducing toil leaves us the time and energy to make Tigris the best object storage product we can.
Key takeaways
With all this in mind, here’s the big lessons you should take from this post and how you can use them to build easy to maintain and expand systems:
- Use the tools you already have: If you already have a robust metrics system that’s already production-critical, use it in ways that it may not have been intended to be used. You downloaded the whole database, you should use the whole database. If you’re already an expert in writing metrics code and using your metrics database, use that to your advantage to make other parts of your stack easier to maintain.
- Give your customers the same information you have: If you’re already collecting this information anyways, show that information to customers. This makes your service more transparent to users and gives them confidence that you’re showing them the right information, especially if that is what you bill on.
- Err on the side of the customer: Billing is a very inexact science. If you are going to make errors in your process of calculating how much to charge a customer, make sure that you err on the side of the customer. This does mean you potentially absorb costs more than you’d need, but it’s much better from a customer trust standpoint to err in their favour. Eventually consistent distributed systems will work themselves out anyways.
Configure your rules,
let time beat ever forward;
escape storage costs.