At Tigris Data, we provide object storage to our users. People put bytes into our servers with a name, and expect that come hell and high water, when they put in the name, they get the exact same bytes back. This is a very high trust position to be in because when people ask themselves things like “Oh, what would happen if my object storage provider is unreliable”, that conversation usually involves phrases like “Maybe we should have gone with The Big Cloud afterall”.
Such conversations are rarely good for the business.

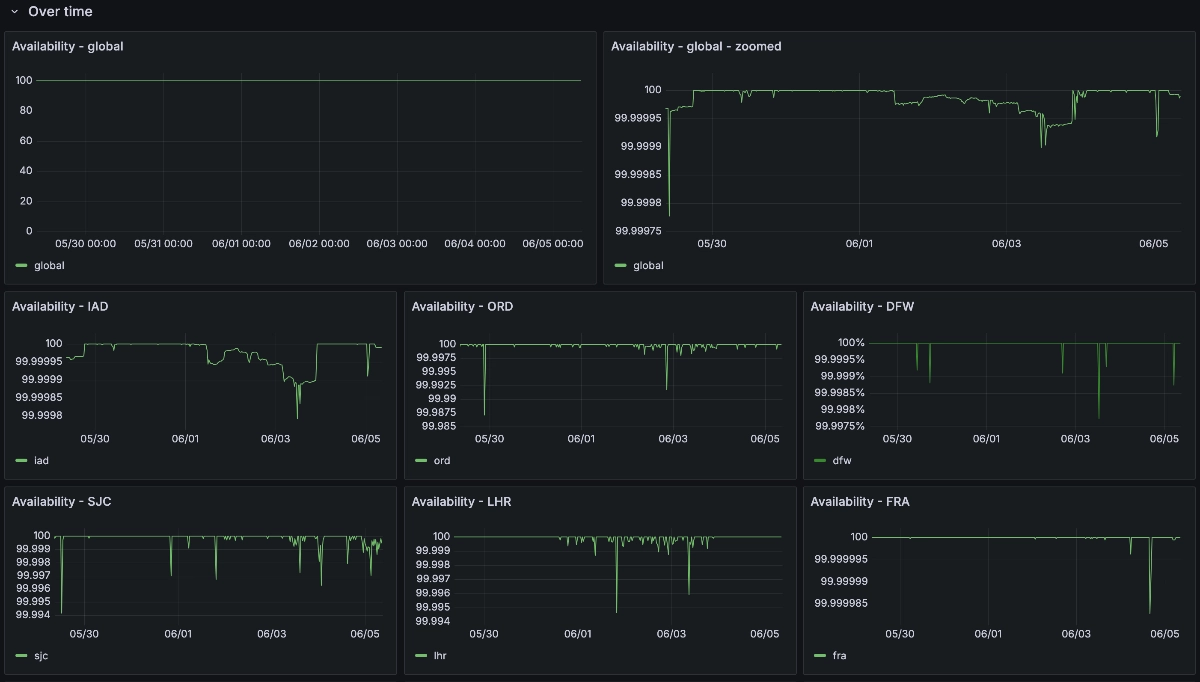
If you store your data in Tigris, you shouldn’t need to worry about a status page full of green checkmarks or anything else that needs to be updated manually. As a result, we’re trying something different. We’re making our internal reliability and performance metrics public. We are serious about making sure that Tigris is globally available 99.99% of the time (that is a total downtime budget of 8 seconds per day or less than an hour per year).
Don’t believe us? You don’t need to. Check out our live dashboard embedded right here:
View the dashboard full screen
As far as we can tell, we’re the first of our kind to share this raw, unfiltered reliability metrics dashboard publicly. These are the same numbers that we use to calculate our reliability.
Go ahead. Make a storm of requests against the API and refresh. We’re serious.
When we first took a look at this data while writing this post, we noticed that a temporary failure in our metadata service was making some users unable to write files in a region. This is unacceptable for us.
We’d rather you have more latency than less availability.
In order to work around this, we took advantage of the fact that Tigris is global and the data largely does not care where it is stored. Whenever the metadata service is flaky or failing in one region, requests are seamlessly re-routed to the nearest available region’s metadata service. Automatically. Without any human intervention. This ensures that all user requests will be processed, even if it’s a bit slower it’s better than the requests not being processed at all.
In our ideal world, we should be able to lose entire regions without users noticing or caring (save some extra latency).
Site reliability people are well known for cooking metrics and/or mincing the definition of words such that “available” means “50% or more requests are processed” or making it a simple binary of “does any request at all work”. We’re choosing a different path. Our availability metric is based on real requests to our production system. When we calculate availability, we do something like this:
function availability(
  successfulRequests: number,
  totalRequests: number
): number {
  return successfulRequests / totalRequests;
}
We define “successful” requests as any request that triggers a non-5xx response. Under our definition, an authentication failure (401) or a file not found (404) is still a successful request (as the system is correctly denying access or not finding a file that may not exist), but an internal server error (500) would be a failed request and thus count against us.
Want to try it out?
Make a global bucket with no egress fees
Why these metrics matter
It’s easy to be reliable when nobody uses your service. There’s also annoying chicken-and-egg problems with startups offering highly performant services. As you scale up, you need more reliability (every millisecond wasted retrying requests is another millisecond that could have gone to the money generator), but demonstrating reliability requires high scale usage due to the observation paradox.
So we’re proving it to you by showing you our live production data for latency and availability. The truth requires no belief. There is no need to trust us on our latency and availability metrics when you can just look at them for yourself.
Convinced? Make a new bucket today and give Tigris a try.